
Understorey and trees on intensive plot |
Aims
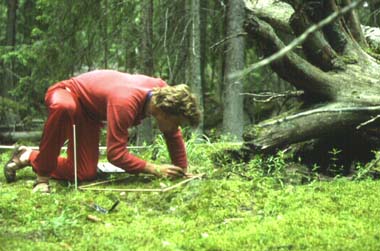
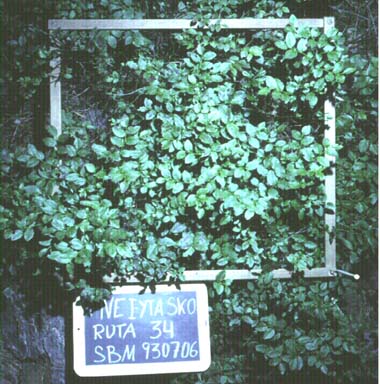
Several of the vascular plants, mosses and lichens show a characteristic reaction to environmental impact such as acid rain and nitrogen deposition – they are indicators. For many species sensitivity values have been established which may be used in calculating a plant community index as regards soil pH and content of nitrogen. A time series of observations of species abundance gives a basis for calculation via index how the community has been influenced in one direction or the other by airborne pollutants. A major problem is that most indicator values established are valid for continetal Europe, centering in Germany (Heinz Ellenberg). This means that they may be applied in south Sweden with some confidence but not in the north. A number of southern deciduous forest species have received Swedish values, but for the coniferous forest in central and northern Sweden reliable indicator values are still missing. Attempts have been made to establish such values for a limited number of common species using Swedish National Forest Survey data of plants and soil. Since all species are observed the data also give the dynamics of plant diversity in the particular community observed. The understorey and trees are observed on one or two plots of about 4x40 m, situated in one or two plant communities representative of the site. The understorey vegetation, i.e. the field and bottom layers, is monitored annually to every three years on 32 squares (50x50 cm) distributed two each randomly on 10x10 m subplots – startified random sampling. There the cover of all species is estimated visually and the fertility of vascular plants. Trees are mapped initially and their height, stem diameter and vigour observed every five years. At the same time windthrows and stumps are measured and their degree of decomposition estimated.
Variables
|
 |
|
|
 |
|
|
 |
|